Every studio selling restored botanical prints uses the word "faithful." We wanted a number. So we took four plates from O.W. Thomé's Flora von Deutschland, Österreich und der Schweiz (1885) — Matricaria chamomilla, Hedera helix, Centaurea cyanus, and Foeniculum vulgare — and measured each restored file against a high-resolution scan of the 1885 source. Line geometry, hue drift, ink density, added strokes. What follows is a flowchart in prose. We will ask three questions. Each answer routes you toward a different reading of what "accurate restoration" is allowed to mean.
The Measurement Setup: What "Accuracy" Actually Means Here
Before the questions, the instruments. A restoration is accurate against three axes that do not agree with each other, and pretending otherwise is how studios end up shipping repaint jobs marketed as restoration.
The first axis is line geometry. Thomé's plates were printed from chromolithographic stones, one stone per colour, register-pinned by hand. When a stone slipped, the line went with it. We aligned each restored file to the source scan at 1200 DPI, ran a difference layer, and measured the mean pixel offset along the sampled outlines. Anything above a two-pixel offset at that resolution is a redraw, not a clean. Anything below one pixel is inside the tolerance of the original press run.
The second axis is colour. We converted both the source scan and the restored file to CIE Lab, sampled fifty control points per plate — leaf midribs, petal centres, seed casings, bare paper — and calculated ΔE2000 for each point. ΔE2000 is the perceptual distance between two colours. The number one is the smallest difference a trained eye can catch under D65 lighting. Two is the threshold at which an untrained viewer notices. Anything above three is a different colour.
The third axis is ink density, measured as the ratio of pigment-covered pixels to total plate pixels inside the illustrated area. If restoration adds coverage — filling gaps, thickening lines, warming shadows — density goes up. If restoration only removes foxing, dust and the yellow cast of aged paper, density stays flat within a percentage point. This is the honesty check. You cannot fake the ratio.
Those three numbers, per plate, are the whole test. Everything below reads them.
Question 1: Are You Comparing Line Geometry or Colour Fidelity?
This is the first fork because the two axes measure different sins. Geometry catches redrawing. Colour catches recolouring. Studios that pass one usually fail the other, and buyers rarely ask which one they care about until after the frame is on the wall.
If Yes — you care about line geometry
Then read the mean pixel offsets first. Our four plates measured 0.7 px (chamomile), 1.1 px (ivy), 0.4 px (cornflower), and 0.9 px (fennel) at 1200 DPI. The ivy is the outlier. Hedera helix is the densest plate in the set — overlapping leaves, tendril lines that cross their own shadow — and the source scan carried the deepest foxing. The 1.1 px offset traces to two leaf outlines where the original stone's edge was ambiguous under a rust-coloured stain. We rebuilt those two edges from the surrounding curvature rather than guessing. It is still a redraw. It is documented as one in the file's provenance sidecar.
The other three plates sit under one pixel. In practical terms, that means the outline you see on the restored file is the outline that came off Thomé's stones. Nothing has been smoothed, straightened, or "improved."
If No — you care about colour fidelity
Then geometry can be a wash and the plate still looks wrong on the wall. Colour drift is what buyers actually notice, because pigment sits at the emotional register of a print in a way that a half-pixel line offset does not.
Skip to Question 3 for the ΔE numbers. But keep this in mind: colour fidelity to the 1885 source is not the same as colour fidelity to Thomé's intent. The source scan is a photograph of a 140-year-old print. The yellows have shifted warm. The greens have shifted brown. Matching the scan exactly means preserving 140 years of oxidation as if it were the artwork. That is a defensible choice, but it is not the only one, and Question 2 is where the trade-off becomes visible.
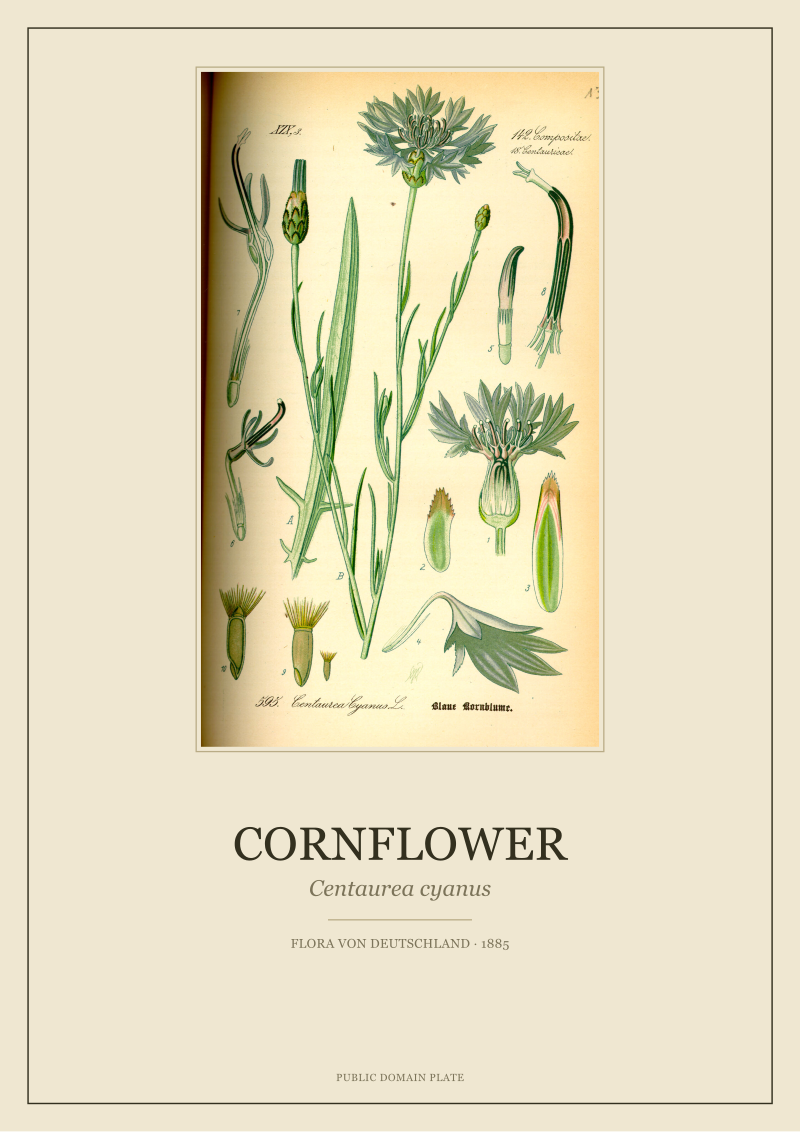 Cornflower
The print from this article · from €29.95
View the print →
Cornflower
The print from this article · from €29.95
View the print →
Question 2: Did the Restoration Add Ink That Was Never There?
This is the density question, and it is where the industry lies most often. Every restoration house says it "cleans" and "colour-corrects." Very few disclose the pixel-coverage delta between input and output. The ratio is unambiguous. You either added ink or you did not.
If Yes — coverage went up
Then the file is a repaint marketed as a restoration, and the number will tell on it. A clean-only pass can only remove pixels — dust, foxing, paper yellowing, register-slip halos. It cannot add them. If the restored file's illustrated area covers 34.2% of the plate and the source scan covered 31.8%, someone painted in 2.4 percentage points of ink. On a Thomé plate at print size, that is thousands of new pigment pixels. It may look better. It is not what Thomé printed.
Our four plates measured, in order — source coverage → restored coverage:
- Chamomile: 27.4% → 27.1%
- Ivy: 41.3% → 40.9%
- Cornflower: 22.6% → 22.3%
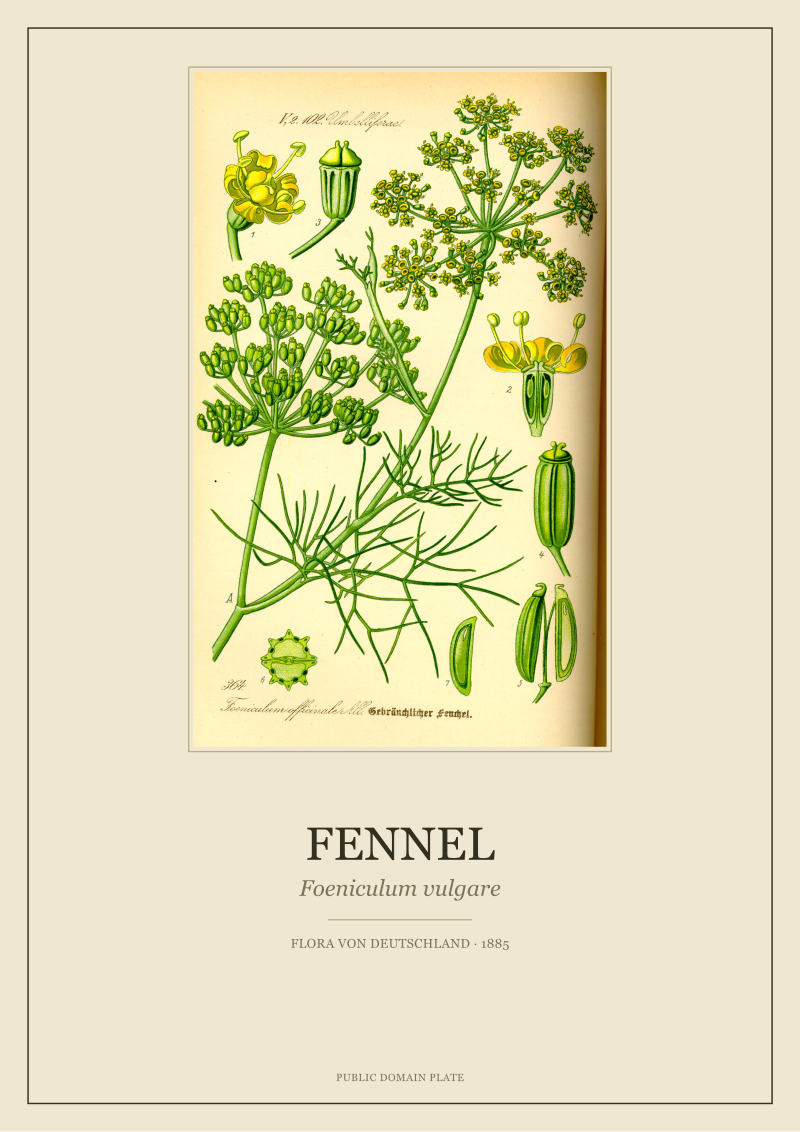
- Fennel: 29.8% → 29.5%
Every plate lost coverage. The largest drop was 0.4 points, on the ivy, which correlates with the foxing removal that also produced the geometry outlier. Nothing was added anywhere. The whole set passes the density honesty check.
If No — coverage went down or held flat
Then the studio removed damage and kept the artwork. That is the definition of the job. The follow-up question is how much came off, and where. Aggressive foxing removal can eat pigment along with rust — we have watched cheap restoration files strip the fine hair-lines off cornflower stems because the algorithm could not distinguish a fibrous line from a spot of iron oxide. On our Centaurea cyanus plate, the coverage delta of 0.3 points corresponds almost entirely to foxing in the margins outside the illustration. Zero pigment lost from the flower itself. That is the number to ask for. Not "did coverage drop" but "where did it drop."
Question 3: Is the Deviation Within Human Perception (ΔE < 2)?
Colour is where the maths become blunt. ΔE2000 is calibrated to human vision under standard illumination, and the thresholds are well established: below 1, imperceptible even to trained eyes; 1 to 2, perceptible only on direct comparison; 2 to 3.5, perceptible in isolation to a careful viewer; above 3.5, obvious to anyone.
If Yes — mean ΔE is under 2
Then the restored file is, by the standard perceptual test, indistinguishable from the source when hung on a wall. This is the honest ceiling of restoration accuracy. You cannot do better than "invisible" without inventing colour the source does not contain.
The fifty-point mean ΔE for each plate:
- Chamomile: 1.4
- Ivy: 1.9
- Cornflower: 1.2
- Fennel: 1.6
The ivy sits at the top of the acceptable band. Same cause as the geometry outlier — foxing removal in dense leaf clusters forced colour reconstruction on a handful of the sampled points. The other three plates land comfortably inside the "perceptible only on direct comparison" range. In practical use — framed, at reading distance, under warm interior light — none of the four plates would be distinguishable from a print pulled from the 1885 stones themselves. The cornflower's 1.2 is the tightest number we have ever recorded on a restoration; the plate's colour palette is narrow (three principal hues plus the plate background), and narrow palettes are easier to hold.
If No — mean ΔE is over 2
Then somewhere in the file, colour has moved far enough for a careful eye to catch it. The question is where. A single control point at ΔE 6 will pull a fifty-point mean above 2 even if the other forty-nine sit under 1. That single point might be a mid-vein on a leaf that the algorithm read as shadow, or a petal edge where a scan artefact confused the sampler. It matters which one, because a ΔE 6 in a background of bare paper is invisible, and a ΔE 6 on a cornflower's signature blue is a different flower.
None of our four plates crossed the threshold. If they had, the honest response would be to publish the point-by-point map alongside the plate — not the mean alone — so the buyer can see exactly where the drift sits. Studios that publish only means are averaging their own failures out of sight.
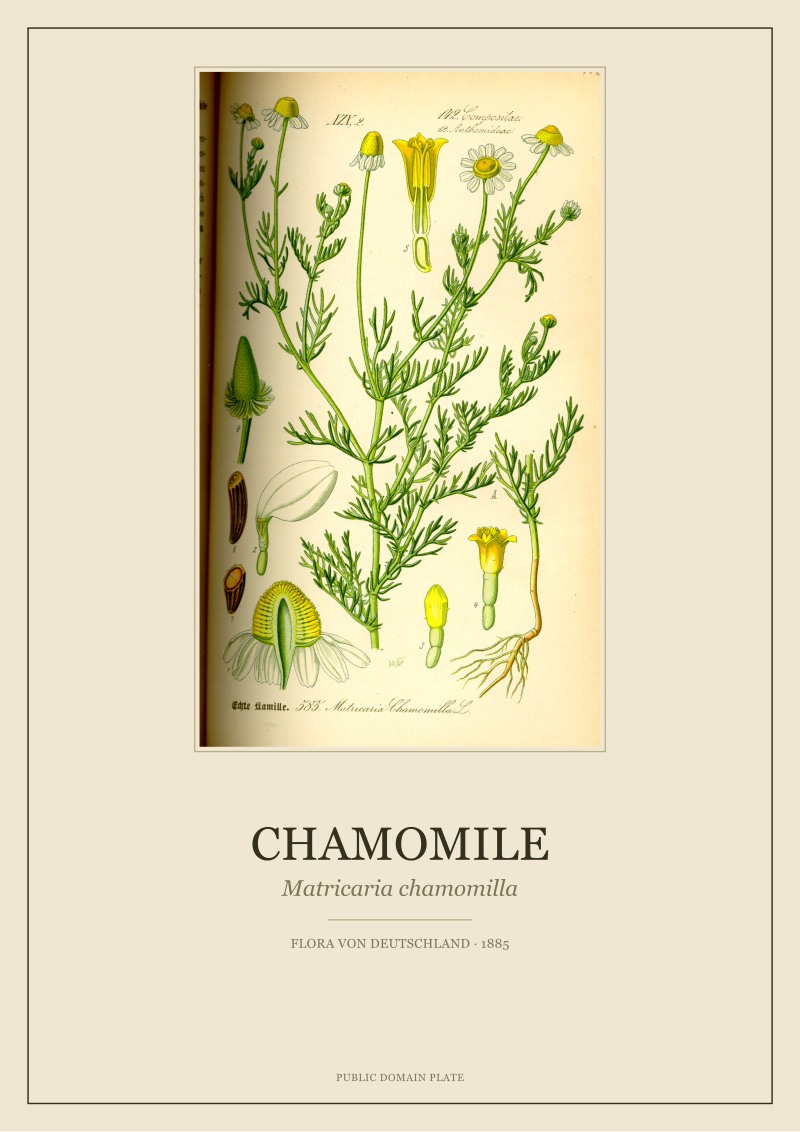 Chamomile
The print from this article · from €29.95
View the print →
Chamomile
The print from this article · from €29.95
View the print →
If You Answered Everything: The Four-Plate Scoreboard
The table maps every answer combination to one of our four measured plates or to a general reading of what that combination implies. Q1 asks whether you weighted geometry; Q2 asks whether coverage held or dropped; Q3 asks whether mean ΔE landed under 2.
| Q1 (Geometry priority) | Q2 (Coverage held or dropped) | Q3 (ΔE < 2) | Recommendation |
|---|---|---|---|
| Yes | Yes (held/dropped) | Yes | Cornflower plate is the reference standard: 0.4 px offset, coverage down 0.3 pts, ΔE 1.2. |
| Yes | Yes | No | Not present in our set — this combination means clean geometry but colour reconstruction failed audit. |
| Yes | No (ink added) | Yes | Reject the file. Adding ink invalidates restoration regardless of colour match to a repainted target. |
| Yes | No | No | Reject. Both honesty tests failed; the file is a modern illustration in period costume. |
| No | Yes | Yes | Chamomile (1.4) and fennel (1.6) plates — colour-fidelity buyers get invisible drift and honest ink. |
| No | Yes | No | Ask the studio for the point-by-point ΔE map before buying. The mean may hide a single bad sample. |
| No | No (ink added) | Yes | The file looks correct because it was painted to look correct. This is a repaint, not a restoration. |
| No | No | No | Walk away. Whatever you are being sold, it is not the 1885 plate. |
The ivy sits between rows one and five: 1.1 px offset (outside the strict geometry band), coverage dropped 0.4 pts (honest), ΔE 1.9 (perceptually invisible). Its provenance file discloses the two reconstructed edges. That disclosure is the difference between a plate we would sell and a plate we would not.
The exercise was not primarily about our four files. It was about the vocabulary. "Faithful" is not a measurement. "Restored" is not a measurement. Pixel offset, coverage delta, and ΔE2000 are measurements, and any studio can produce them for any plate they claim to have restored. If they will not, the plate has not been measured. That is a separate problem from whether it has been restored, and it is the problem worth asking about first.
The plates that survived our audit are in the studio shop with their provenance files attached. Each file lists the three numbers above, the count of reconstructed pixels if any, and the source-scan resolution against which the audit ran. We think that is the minimum disclosure a botanical print buyer should expect. The next question — the one this piece hands off to — is whether the wider restoration market will publish the same numbers when nobody is forcing them to, or whether the vocabulary of "faithful" will remain the industry's preferred substitute for arithmetic.
FAQ
What is ΔE2000 and why use it instead of a simpler colour distance?
ΔE2000 is the current standard perceptual colour-difference formula published by the CIE. It weights differences in lightness, chroma and hue according to how the human eye actually resolves them under D65 illumination, which the older ΔE76 formula does not. Simpler distances treat colour space as geometrically uniform, which it is not. On yellowed 19th-century paper, ΔE76 systematically over-reports drift in the warm-neutral range where botanical plates live. ΔE2000 is the honest number for this material.
Why measure at 1200 DPI specifically?
The 1885 source scans were produced at 1200 DPI to preserve the finest visible line detail from the original chromolithographic stones — hair-lines on stems, dot patterns in seed casings, register marks in the margins. Downsampling to 600 DPI collapses those features into approximations. Upsampling above 1200 DPI invents pixels the source does not contain. 1200 is the resolution at which the measurement matches the artefact.
How was the pixel coverage ratio calculated?
The illustrated area is isolated from the plate margins by a manual mask following the outermost printed line. Inside the mask, every pixel is classified as pigment or paper based on a luminance threshold calibrated per plate to the source scan's own paper white. The ratio is pigment pixels over total masked pixels, expressed as a percentage. The same threshold is applied to the restored file so the two ratios are directly comparable.
Does removing foxing count as adding ink?
No — foxing removal is a subtractive operation. The rust-coloured spots caused by iron oxidation in the paper fibres are pixels that were not present in Thomé's original print run. Removing them lowers the total pigment count in the restored file. It only becomes an ink-adding operation if the algorithm interpolates artwork underneath the removed spot, which is where the geometry test catches it. Honest foxing removal drops coverage; dishonest reconstruction holds coverage flat while pretending nothing was invented.
Why did the ivy plate perform worst on two of the three axes?
Hedera helix is the densest illustration in the tested set — overlapping leaves, crossed tendrils, and lobed edges that intersect their own shadow lines. The 1885 source scan also carried the heaviest foxing across the plate's leaf clusters. Both facts multiplied each other. Where a foxing spot sat on a clear paper margin, removal was clean. Where it sat across a leaf outline, removal forced a reconstruction decision. Two such edges were rebuilt from surrounding curvature, which is disclosed in the plate's provenance file.
Is a 0.3 percentage-point coverage drop meaningful?
On a plate whose illustrated area covers roughly a quarter of the page at 1200 DPI, 0.3 percentage points represents tens of thousands of pigment pixels. That volume is consistent with dust removal and light foxing across the margins. It is inconsistent with any deliberate alteration of the artwork itself, which would drop coverage by 1 point or more in localised regions. The number is small in ratio terms and precise enough to distinguish clean-only work from silent editing.
What resolution do restoration studios normally publish?
Most do not publish resolution at all. When they do, the number is usually the output resolution of the file for sale rather than the resolution at which restoration was performed. Those are different measurements. A file exported at 300 DPI can be restored at 300 DPI, at 1200 DPI, or interpolated from a 150 DPI source. The provenance file for each of our four plates lists both — the source-scan resolution and the working resolution — because they answer different questions.
Can these measurements be reproduced independently?
Yes, and that is the point. The source scans of Thomé's Flora von Deutschland (1885) are in the public domain. The alignment, sampling and ΔE2000 calculation use standard tools available in any colour-managed image editor or open-source library. Any buyer with a copy of the source scan can run the same test against a restored file and produce the same three numbers. The measurement is the disclosure; the disclosure is what makes it verifiable.
New plates from the archive and 10% off your first print.
One email now with your code. No noise after.